A month into the U.S.-Israel war with Iran, the conflict has become less about a dramatic single battle and more about endurance: whether Washington can sustain military pressure without sliding into an open-ended ground commitment, and whether Tehran can keep inflicting economic pain—especially through energy disruption—without triggering overwhelming escalation.
Major outlets and official data confirm that U.S. planners are actively preparing options that could involve forces operating on Iranian soil, but they also show that some widely shared claims about timelines, markets, and “certainty” of outcomes are either overstated or internally inconsistent. This article synthesizes what credible reporting and primary-source economic data say right now—and where speculation goes beyond the evidence.
What we actually know about potential U.S. ground operations
Recent reporting does not show a publicly declared U.S. decision to launch a full-scale ground invasion of Iran. What it does show is extensive contingency planning and force movements that would enable limited ground operations, such as raids, seizures of specific sites, or operations supporting maritime objectives. The Washington Post has reported the Pentagon is preparing for weeks-long ground operations, framed more as limited raids than a conventional occupation-style invasion.
U.S. deployments are consistent with “options-building.” The Post and the Associated Press have reported orders and preparations involving elements of the 82nd Airborne Division headed to the region, alongside additional Marine and naval deployments—moves that increase U.S. capacity for rapid-entry missions but do not, on their own, prove an invasion decision.
On the specific claim that The Wall Street Journal “confirmed” the United States is prepared to drag the war out “for at least two months,” the accessible WSJ reporting points in a more complicated direction. In a WSJ live-coverage item, Secretary of State Marco Rubio reportedly told G7 counterparts the war would continue for two to four weeks, adding it should end “in a matter of weeks, not months”. That does not rule out a longer conflict—wars often outlast official expectations—but it does directly contradict the idea that WSJ has presented “at least two months” as a confirmed baseline.
Where does the “two months” idea come from? Some private-sector scenario work has described “up to two months” as an upper bound rather than a floor—Oxford Economics, for example, characterized the conflict as likely lasting one to three weeks, “at most” two months. In other words, “two months” appears in analysis as a risk range, not a settled official timetable.

Iran’s stance and why “invading” is not the same as “winning”
Iranian public messaging has been aimed at deterrence and signalling readiness to fight on the ground. In an AP report, Iran’s parliamentary speaker Mohammad Bagher Qalibaf warned that if the United States launches a ground invasion, U.S. forces would be “set on fire”. Other Iran-aligned messaging has likewise emphasized resolve and a willingness to sustain casualties.
The viral claim that “Iran cannot be captured through a ground invasion” is rhetoric, not a measurable military theorem—but the underlying point (that occupying Iran would be extraordinarily difficult) is broadly consistent with professional military analysis. Iran’s geography and scale matter: it is large, mountainous in key regions, and contains major population centres that would be extremely costly to seize and hold. A West Point Modern War Institute analysis argues that Iran’s “human geography” makes invasion and occupation strategically foolish—precisely because people, terrain, and infrastructure create compounding operational problems. Foreign Policy likewise underscores that Iran’s rugged terrain and coastline shape the war and confer major defensive advantages.
Crucially, a limited ground mission is qualitatively different from a regime-toppling occupation. Reporting and expert commentary describe options such as seizing or blockading strategic assets (for example, facilities linked to oil exports or maritime control) or conducting special operations to secure sensitive materials. WIRED notes that a U.S. ground mission aimed at nuclear-related objectives would be extremely complex and dangerous—and could still fail—because of dispersion, fortification, and the operational challenges of moving and securing hazardous materials. Al Jazeera similarly summarizes the consensus: a full invasion would be difficult, but a small, precise mission is plausible—and still risky. One reason this distinction matters is political: the U.S. can “prepare for ground operations” without politically committing to “invading Iran” in the Iraq-2003 sense. This gap between capability-building and decision-making is where public debate—and misinformation—often expands.
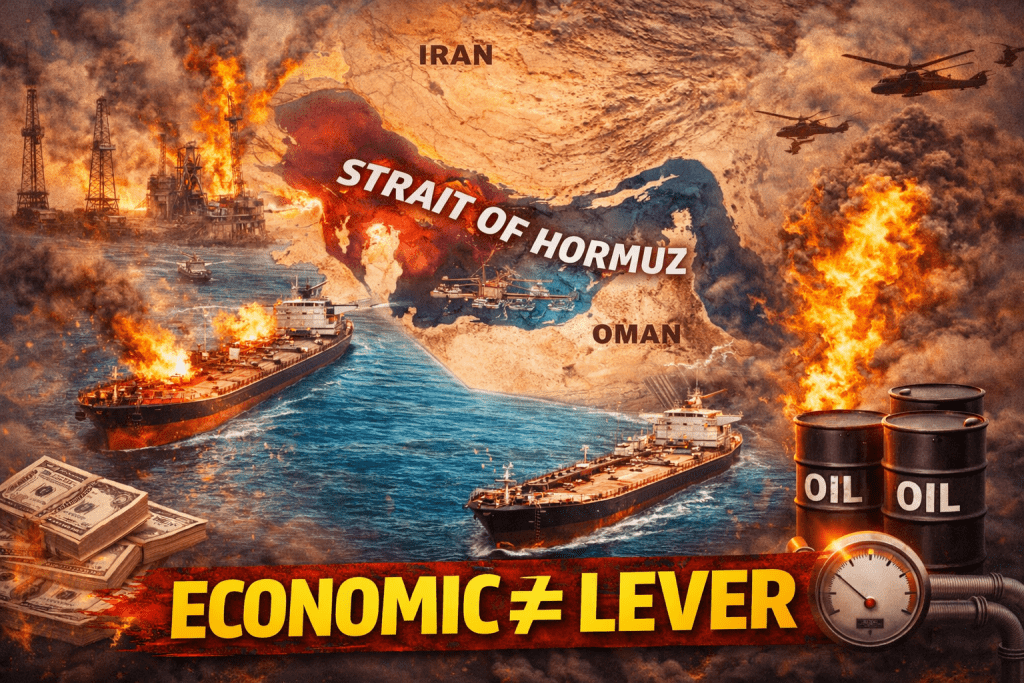
The Strait of Hormuz and energy supply as the main economic lever
If you want one variable that reliably transmits battlefield events into everyone’s daily life, it is energy—especially the Strait of Hormuz. The [U.S. Energy Information Administration (EIA)] reports that in recent years the strait has carried around twenty million barrels per day, roughly one-fifth of global petroleum liquids consumption, with limited alternatives if flows are blocked. The International Energy Agency (IEA) likewise describes Hormuz as one of the world’s most critical oil transit checkpoints, with similar daily volumes.
In the last month, credible outlets have documented severe volatility and sharp price moves tied to fears over Hormuz access and damage to Gulf energy infrastructure. The Guardian reports Brent crude rose sharply through March, hitting a high near one hundred twenty dollars per barrel and logging an extraordinary monthly gain linked to the war and disruptions around Hormuz. Le Monde describes “unprecedented volatility,” including an episode where Brent spiked near one hundred twenty dollars and then fell dramatically in a single day, underscoring how headline-driven and fragile the market has become.
The IEA has publicly described the situation as the largest supply disruption in the history of the global oil market and has published demand-side measures governments can consider to reduce pressure on consumers. And the IEA’s executive director has warned the energy shock represents a major threat to the global economy, citing damage to numerous energy facilities across the region. This context is why the viral framing—“trust oil prices, not politicians”—resonates, even if it overstates how perfectly oil reveals intent. Oil prices are not a moral truth machine; they are a fast-moving composite of supply expectations, shipping risk, insurance costs, reserve releases, speculation, and geopolitical signalling.
It is also important to correct one specific assertion: the claim that oil “never dropped” and remained above one hundred ten dollars. Prices have indeed traded above one hundred ten at moments (for example, Brent around one hundred eleven in late March reporting), supporting the idea of sustained stress. But reporting also shows oil sometimes fell below one hundred amid ceasefire or “pause” hopes; AP, for example, reported Brent falling into the high nineties during a mid-week relief move. The takeaway is not “oil never drops”—it’s that oil has remained structurally elevated and extremely volatile, which is enough to shift inflation expectations and policy assumptions.
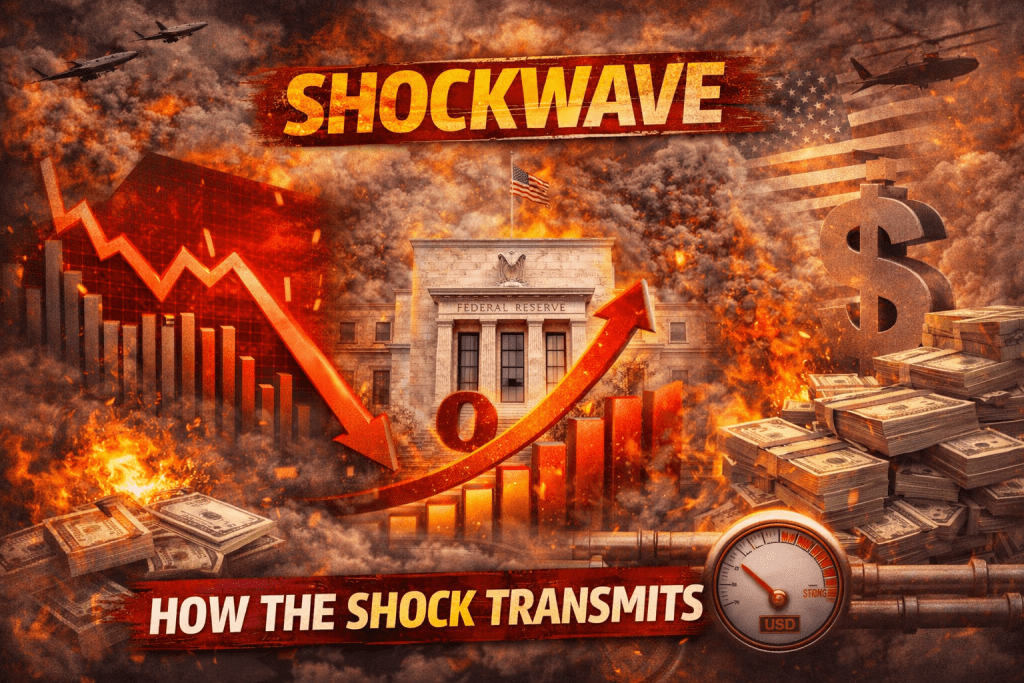
Markets, interest rates, and the dollar: how the shock transmits
The war’s economic mechanism is straightforward: an energy shock raises expected inflation, inflation risk shifts central-bank expectations, and those shifts reprice everything—equities, bonds, currencies, and even traditional “safe havens”.
Equities and the market-cap wipeout question
U.S. equities have sold off sharply in multiple sessions tied to war developments and the perceived durability of any negotiation track. AP has reported the worst drops since the war began, with the Nasdaq entering correction territory and broad declines across global markets when hopes for an “off ramp” faded. Barron’s likewise describes a market under strain, with rising yields and concerns about stagflation-like dynamics.
On the headline claim that five trillion dollars in market cap “vanished,” the most accurate way to treat it is as an order-of-magnitude statement whose precision depends on what you measure. One widely circulated report put the S&P 500’s market-cap loss at about four-point-six-seven trillion dollars since the war began. Even if you do not accept any single estimate, multiple sources converge on the key reality: the equity drawdown is firmly in the multi-trillion-dollar range, which is enormous in wealth-effect terms and can feed back into consumer confidence and spending.
The comparison in the prompt—“that’s more than India’s GDP”—can be directionally true depending on the market-cap loss figure you accept. For context, the IMF’s World Economic Outlook DataMapper projects India’s nominal GDP in the mid-four-trillion-dollar range in the near term, while the World Bank lists India’s most recent historical GDP below four trillion.
The Federal Reserve and the “rate cuts backfired” narrative
The prompt argues that Donald Trump wanted rate cuts to boost liquidity and risk assets, but the war forced a reversal into rate hikes. The evidence supports the direction (war reduces the odds of rapid easing) more than the specifics (there have not been wartime rate hikes in the cited period). The Federal Reserve’s own statement shows that at its March meeting it held the target range for the federal funds rate at three and a half to three and three quarters percent. Bloomberg likewise reports the Fed held rates and continued to project limited easing, while emphasizing higher uncertainty and the need for further inflation progress.
What has changed is market pricing and the rate-cut calendar: higher oil and war uncertainty have pushed investors to expect fewer or later cuts, and to treat the inflation path as riskier. On Trump’s pressure campaign: multiple sources document that Trump has publicly insulted Fed Chair Jerome Powell over the pace of rate cuts, including calling him a “numbskull,” while pressing for lower rates. Whether that stance “backfired” is a judgement, but the macro constraint is real: an oil shock can make easing politically and economically harder because it lifts inflation expectations.
Bonds, yields, and the misconception about “bond prices rising”
A key mechanical error in the viral narrative is the claim that the dollar is strengthening because “bond prices are rising”. In general, bond prices move inversely to yields. In March, the story has often been yields rising and prices falling due to inflation fears and weak auctions—meaning bonds have not consistently provided the classic crisis hedge.
Primary data shows how high “safe” yields have become. The [U.S. Treasury’s] published yield curve shows late-March yields around the mid-four-percent range on the ten-year, and close to five percent on long maturities. FRED’s ten-year constant maturity series likewise shows the ten-year yield around the mid-four-percent range in late March. This helps explain why global capital can be pulled toward U.S. dollar assets: higher yields, deep liquidity, and the dollar’s crisis role can combine to attract flows—even if equities are falling. LSEG analysis notes the U.S. dollar appreciated through March and frames part of that support as linked to the U.S. position as an energy exporter and a destination for risk-off capital.
Gold and crypto: why “safe havens” didn’t behave as expected
The war has produced one of the more counterintuitive market patterns: gold sold off hard instead of rising steadily. The Guardian reports gold fell sharply over the month—its worst monthly performance since the global financial crisis—amid liquidations and broader portfolio stress. Explanations in financial coverage emphasize a familiar crisis dynamic: investors often sell what they can to raise cash, and higher yields increase the opportunity cost of holding non-yielding assets like gold—especially when the dollar is strong.
Crypto has been volatile rather than purely “safe”: reporting shows Bitcoin swinging significantly with shifts in war and policy headlines, sometimes rallying on perceived de-escalation signals and slipping when escalation risk rises. The deeper lesson is that in an energy-and-rates shock, “safe haven” behaviour can be nonlinear: liquidity needs, leverage unwinds, and policy repricing can overwhelm the usual instincts—at least temporarily.
Spillovers to emerging markets and India
When energy prices surge and the U.S. dollar strengthens, the transmission to emerging markets is often brutal: higher import bills (especially for energy), tighter global financial conditions, and currency pressure. AP reporting on the broader economic fallout highlights risk of recession, supply-chain disruption, and pressure on developing countries, including rationing and emergency measures in parts of Asia.
India has been explicitly feeling the market shock. Indian reporting has described large drawdowns in domestic equities and significant erosion of investor wealth since the war began. Even without adopting every local headline figure, the directional reality is clear: in a world of elevated oil and a firm dollar, net-importing economies and risk-sensitive markets are more vulnerable. This is why the “FII outflow” story can become self-reinforcing: higher U.S. yields, a stronger dollar, and uncertain growth abroad can all pull global allocations toward U.S. dollar assets. But it is not automatic, and it can reverse quickly if oil falls, inflation expectations cool, or credible diplomacy reduces the left-tail risk.
Fact-checking the viral claims
Several components of the prompt align with credible reporting, but important parts are either misstated or not supported by accessible evidence. The strongest supported elements are that the Pentagon is preparing for the possibility of U.S. troops conducting operations linked to the conflict, and that deployments have increased U.S. capability in the region. It is also well supported that markets have repriced sharply, oil has surged to extreme highs during March, and the conflict has become an inflation-and-growth shock rather than a distant military event.
The weaker or contradicted elements include the claim that WSJ “confirmed” the war would be dragged out for “at least” two months; WSJ’s own accessible live coverage quotes Rubio arguing the opposite—weeks, not months. The claim that oil “never dropped” is also contradicted by mainstream reporting showing dips below one hundred amid periodic optimism. And the explanation that the dollar is strengthening because bond prices are rising reverses the basic bond-price/yield relationship; much coverage emphasizes that yields have risen and bonds have struggled to provide relief.
Finally, the most alarming claim—an ultimatum about attacking American universities—requires very careful handling. The fact pattern that Iran threatened American-affiliated universities in the region after accusing the U.S. and Israel of striking an Iranian university is supported in WSJ reporting, and AP reporting also notes Iranian threats involving universities. But the specific details in the prompt (an apology deadline and named targets) are not confirmed in the accessible high-quality excerpts; what is confirmed is a broad redefinition of targets accompanied by warnings affecting campuses and students, including in Qatar.
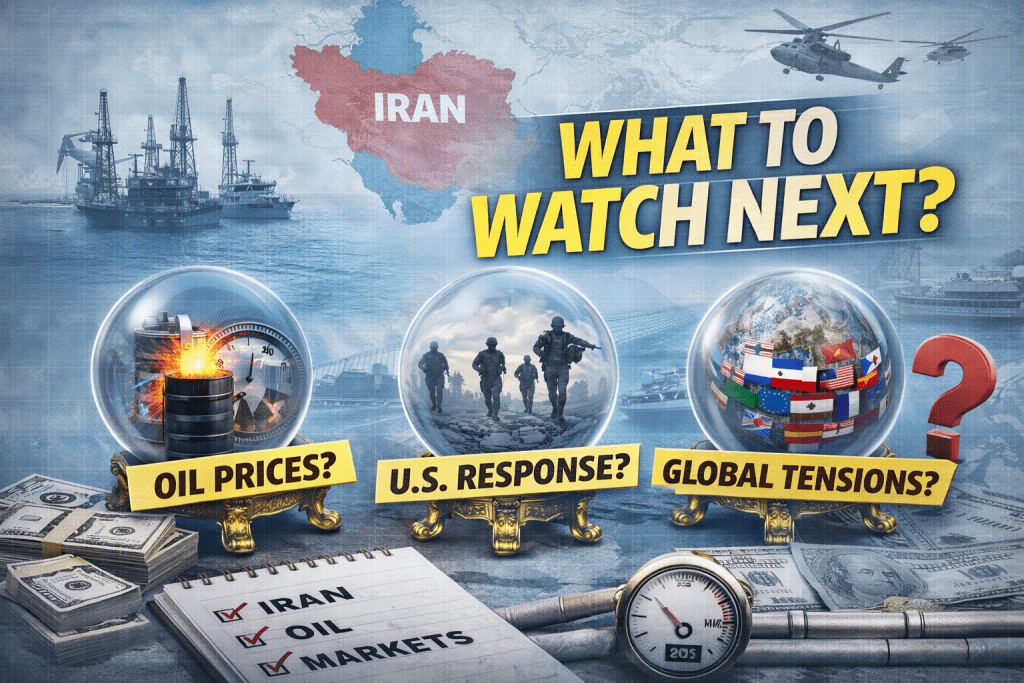
What to watch next
If you are trying to understand whether the war is likely to shorten or lengthen, focus less on confident social-media predictions and more on a small set of observable indicators.
Strait of Hormuz: Sustained reopening and credible security guarantees would be one of the fastest ways to reduce the inflation shock; continued disruption keeps oil elevated and makes global easing cycles harder.
U.S. Force Employment: An expansion from air and maritime operations into recurring ground actions (even limited ones) increases escalation risk and makes “quick end” narratives less credible.
Macro-Policy Channel: The Fed has held rates steady, but rising yields and fewer expected cuts are already tightening conditions.
“Safe Haven” Volatility: A world where oil rises, equities fall, bonds wobble, and gold sells off is a world dominated by liquidity and policy repricing—not by clean, textbook flight-to-safety behaviour. That regime can persist longer than people expect, especially if the energy shock remains unresolved.
Related Reading (CCASTER)
As global tensions rise and systems come under pressure, disruptions are already visible beyond financial markets. For example, airport operations in the U.S. are facing chaos due to staffing issues and policy decisions.
Read: ICE Agents Are Showing Up at U.S. Airports as TSA Lines Spiral Out of Control